Critics often argue about the negative environmental impact of green solutions and cast doubts about their ability to compensate for these impacts. The main reason is the so-called “carbon debt” – a hidden carbon footprint made during their manufacturing or construction process, which they need to repay. But it is not all just about emissions. Material extraction or toxic waste, as a byproduct of manufacturing, is also kind of a big deal.
No need for fuel, need for materials
The basic material used for the production of photovoltaic panels (PVP) is silicon, an element that is derived from quartz. Quartz has to be mined and then heated in a furnace, emitting sulfur dioxide and carbon dioxide into the atmosphere. Besides energy, the manufacturing of PVP also uses a great amount of water. One of the most toxic chemicals released as a byproduct of manufacturing is silicon tetrachloride. This compound can cause skin burns, lung damage, and if mixed with water it can release hydrochloric acid, which is a corrosive substance dangerous for humans and the environment. Fortunately, the majority of manufacturers are now able to safely recycle all these chemicals.
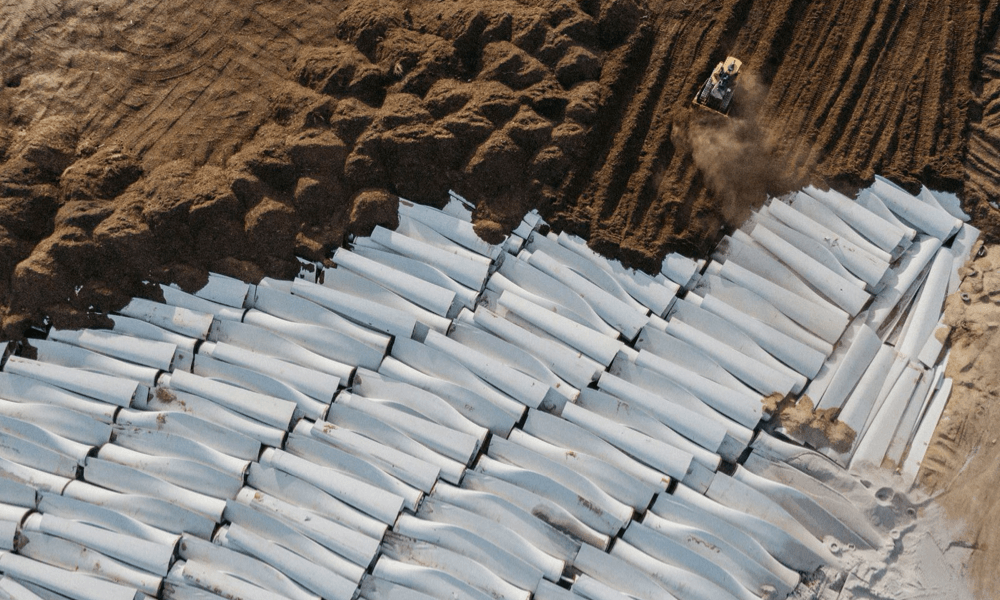
Manufacturing of wind turbines (WT) is much less toxic, compared to solar panels, since they are technologically less complex. They are basically made of steel poles embedded in concrete, a generator, and blades on top. The blades are mostly made of fiberglass, with the newest models made of carbon fiber. They have to be very light but also strong and durable since they are exposed to dust and water particles. These are constantly hitting them at high speed, eroding them and also decreasing their efficiency.
Both the concrete and steel are relatively easy to recycle leading to around 80% recyclability of WT. The problem is caused by the fiberglass blades which are,most of the time, ending up in landfills. Hopefully, not for long. Some companies are already processing them into boards used in construction or they use some of their compounds to make paints, glues and even fertilizers. In the European Union, where it is strictly forbidden to dump them at landfills, blades are usually incinerated for energy. However, their calorific value is quite low and burning them also produces pollutants.
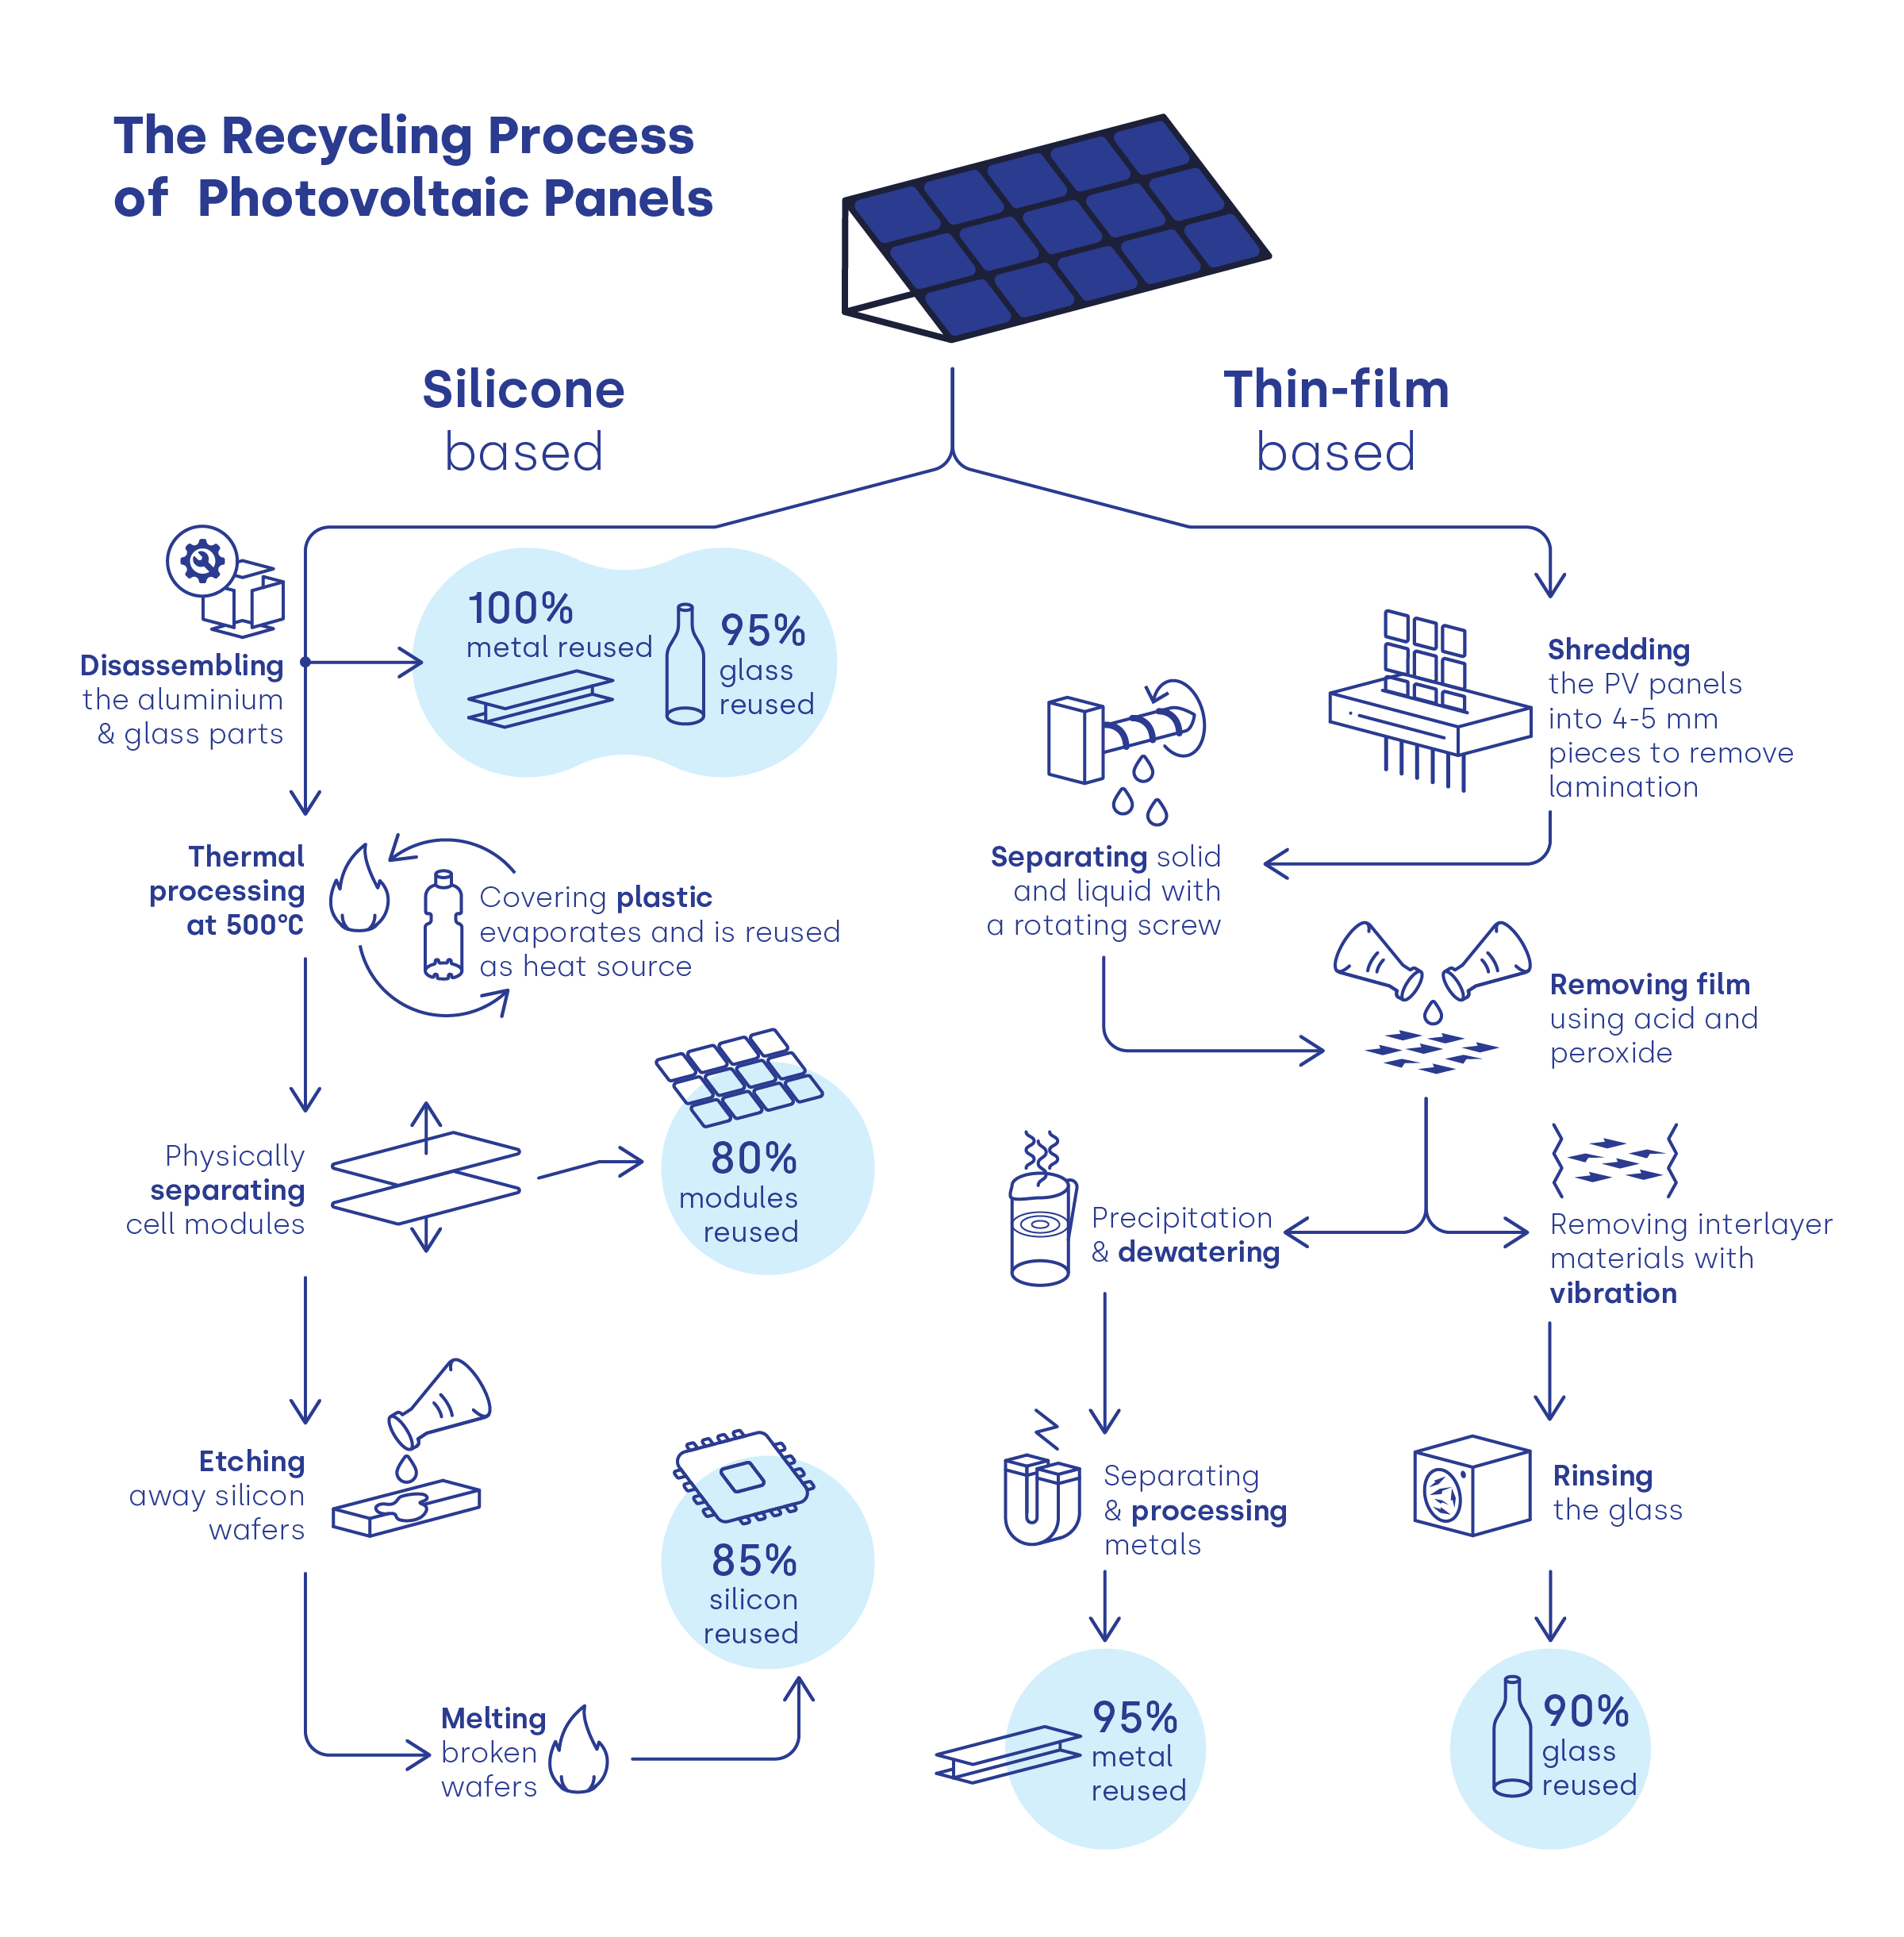
PVPs were adopted much later than WTs and their lifespan is just a little bit longer. That is why nowadays we don’t have much PVP waste. By 2017, only 43,500 tons of PVP waste was created worldwide. For comparison, in 2050 this number is expected to rise to 60 million tons. Today, we are already able to recover up to 96% of the materials from PVP. With better eco-design and new technologies, we may soon be able to re-use all of it.
Carbon debt
It is true that the manufacturing of PVP consumes heaps of electric power and most of the PVPs are made in China – a country where coal power plants still remain the king of the energy mix. It is also true that WTs require big amounts of steel and concrete – materials from sectors that are hard to decarbonize. But coal and gas power plants also use electricity – for the extraction and transportation of fuel. And so does the manufacturing of extraction machinery. Moreover, there are leaks of methane during the fuel-mining process, which is roughly 30 times more potent heat-trapping gas than CO2.
Despite employing technologies for carbon capture and storage (CCS), coal and gas power plants are still much worse in regards to GHG emissions compared to WT and PVP. With a growing share of renewable energy in the energy mix and thanks to the new solutions that make them more affordable, such as brAIn by FUERGY, we can expect the carbon footprint of PVP and WT to keep shrinking over time.
But how to put it in numbers? Well, it depends… Every study has its own methodology leading to slightly different numbers. Nevertheless, all of them have one result in common – a low carbon footprint. Wind and nuclear energy have the lowest carbon footprints among all energy sources, with solar energy right behind them. One of the most recent researches published in Nature Energy in December 2017 has also proven this conclusion.
The biggest discrepancies, in all of the studies, occurred for the biomass and hydro energy. It is because of the high variability of different inputs entering the calculations. For biomass, we need to consider what type of land is used for its cultivation and how this land is managed. Hydropower data, for instance, are highly dependent on the type of land flooded by water and its ecosystems, as the biomass decomposing under the water level also produces GHG.
In our infographic, we are using the official numbers published in the report from the Intergovernmental Panel on Climate Change (IPCC).
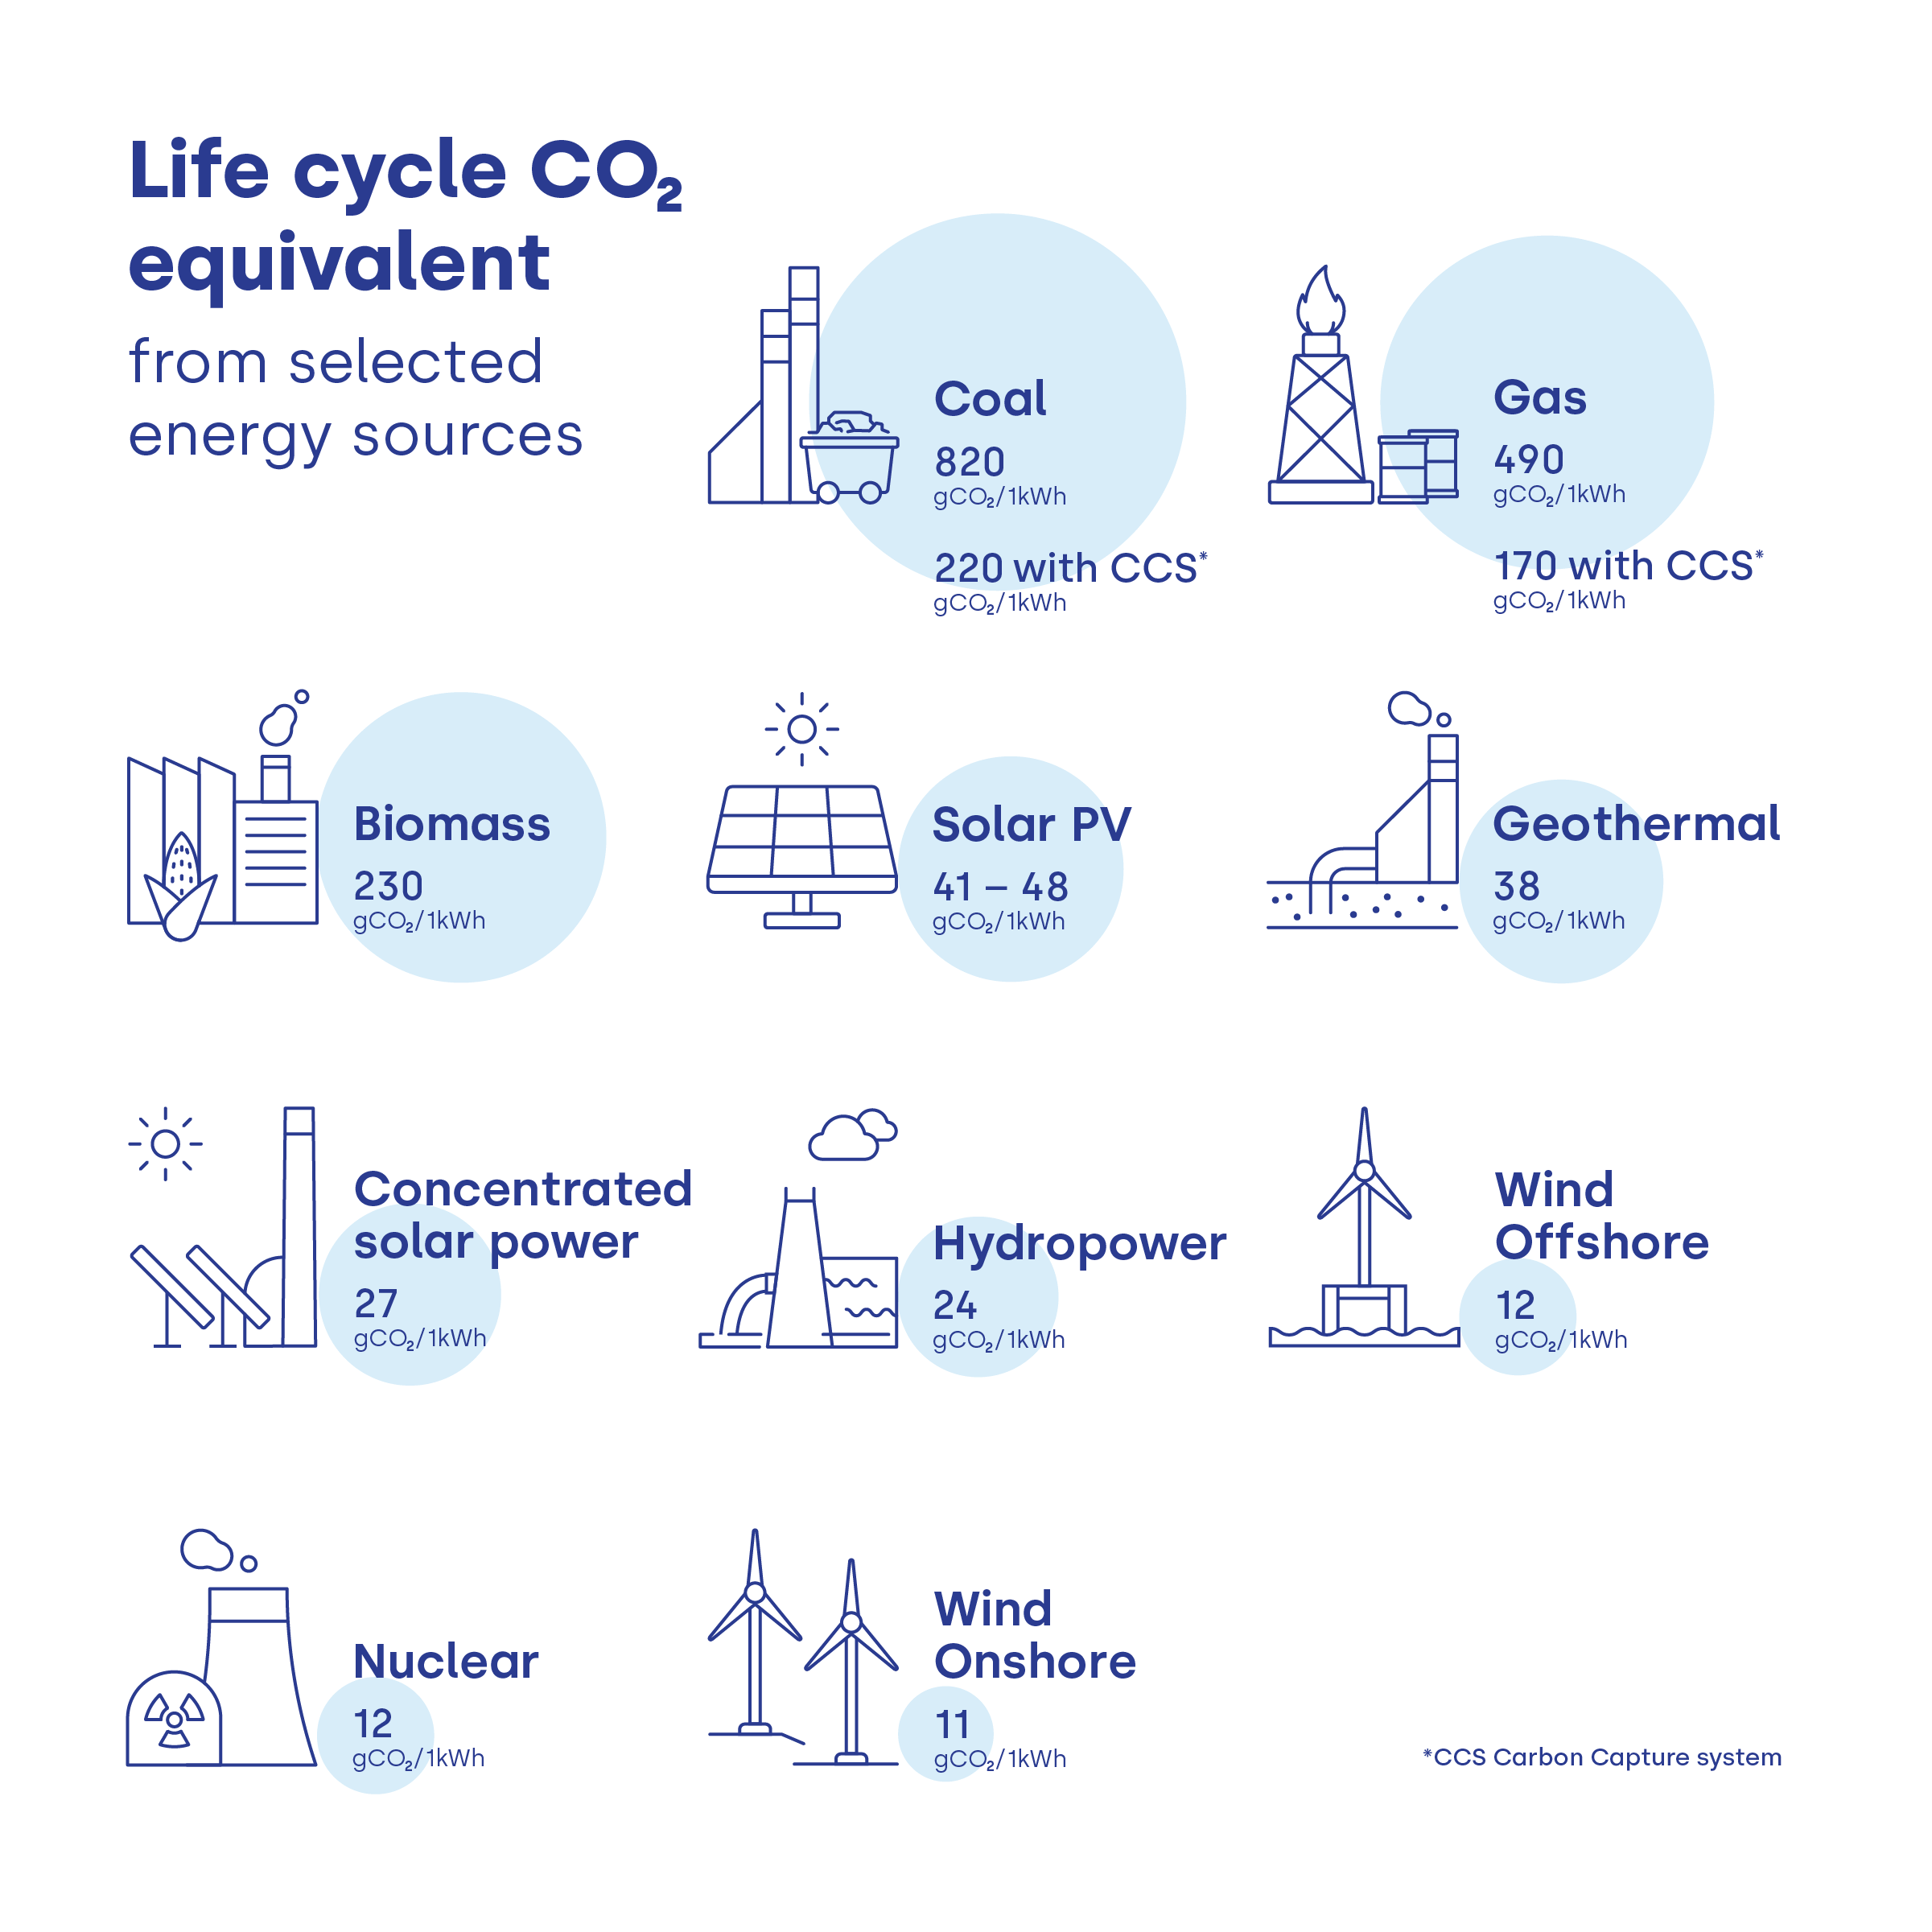
The carbon footprint as well as the environmental impacts of building and operating different types of power plants highly depends on the ecological standards and their real-life application by each country. For example, PVP made in the EU has half of the carbon footprint of one made in China. Nevertheless, solar and wind energy are still one of the cleanest and most accessible forms of energy we currently have at our disposal.
The future of energy does not include just renewable energy sources. We count on energy storage too! Did you know that by their combination we can almost fully replace conventional fossil power plants? If you wonder what the carbon footprint and ecological impact of batteries are, keep following our blog.
We are living in the future of energy. Are you?